
Home › Modules › Royalty analysis
ANALYSISMissing income shows up before the audit does.
It tracks your portfolio year by year, broken down by artist and category, and surfaces a falling or vanished income line as the first sign of under-reporting.
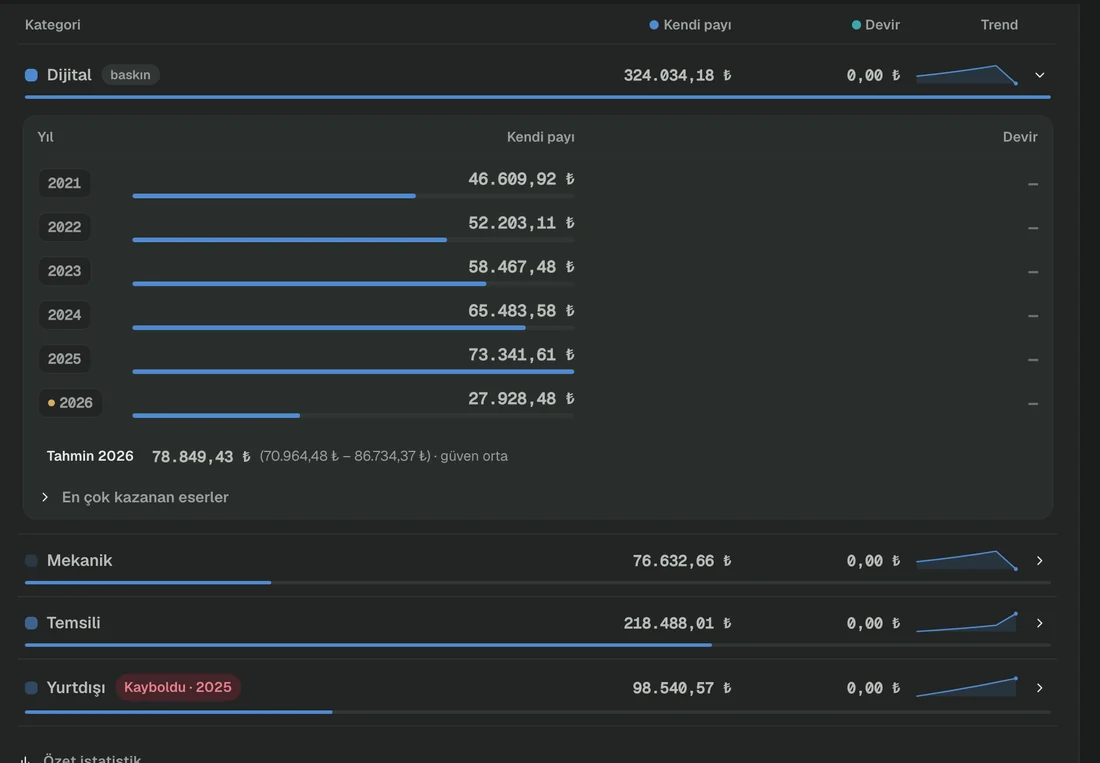
From a demo environment prepared with sample data. Click to enlarge.
The problem it solves
An audit is only possible if you hold the file for that period. Yet the first symptom of a problem usually appears earlier: income an artist receives from one category quietly drops, or that category simply stops appearing one year.
Deviations like this are invisible in the total, because the total is balanced out by growth elsewhere. To see them you have to compare each category against itself, year over year.
How it works
Scan the portfolio
All distribution data in the system is spread across years, broken down by artist and category.
Read the signals
Disappearance, critical drop, drop, statistical outlier and sudden increase are flagged as separate signals, each with its year and category.
Filter out false alarms
Drops seen across the whole portfolio at once are treated as systemic and pushed down — what you are looking for is a deviation in one line.
Take the forecast as a band
No single number is given for the coming period. You get a band with lower and upper bounds and a confidence level for that band. If the data is insufficient, no forecast is produced.
Input and output
WHAT YOU PROVIDE
- Multi-year distribution data held in the system
- Category definitions
WHAT YOU GET
- Yearly series by artist and category
- Flagged anomaly signals
- Forecast band with lower and upper bounds, plus confidence level
- Drill-down to work level
- PDF report
What it does not do
Knowing the limits of a tool matters as much as knowing its capabilities.
- A period that is not yet final counts as provisional; no disappearance signal is raised for that year, because the data is incomplete.
- If data is insufficient, a high-confidence label is never given under any circumstances.
- It does not tell you why a deviation happened — it shows you where it is; finding the cause is yours.
See royalty analysis on a live system.
In a half-hour call we can run it on your own catalogue.